In the realm of project management, Gantt charts are invaluable tools for visualizing timelines, tracking progress, and enhancing overall project organization. Google Sheets, a versatile cloud-based spreadsheet application, offers a user-friendly platform for creating dynamic Gantt charts that cater to your project management needs.
Gantt charts provide a clear and visual representation of project schedules. With tasks laid out in a timeline format, you can easily identify dependencies, allocate resources, and allocate time efficiently.
One of the key advantages of using Google Sheets for Gantt charts is the ability to collaborate in real time. Multiple team members can access and update the chart simultaneously, ensuring everyone stays on the same page with the latest project developments.
A Gantt chart is like a roadmap for your project, allowing you to see the big picture while keeping an eye on the details. This comprehensive view helps in anticipating potential bottlenecks, managing resources effectively, and making informed decisions to keep your project on track.
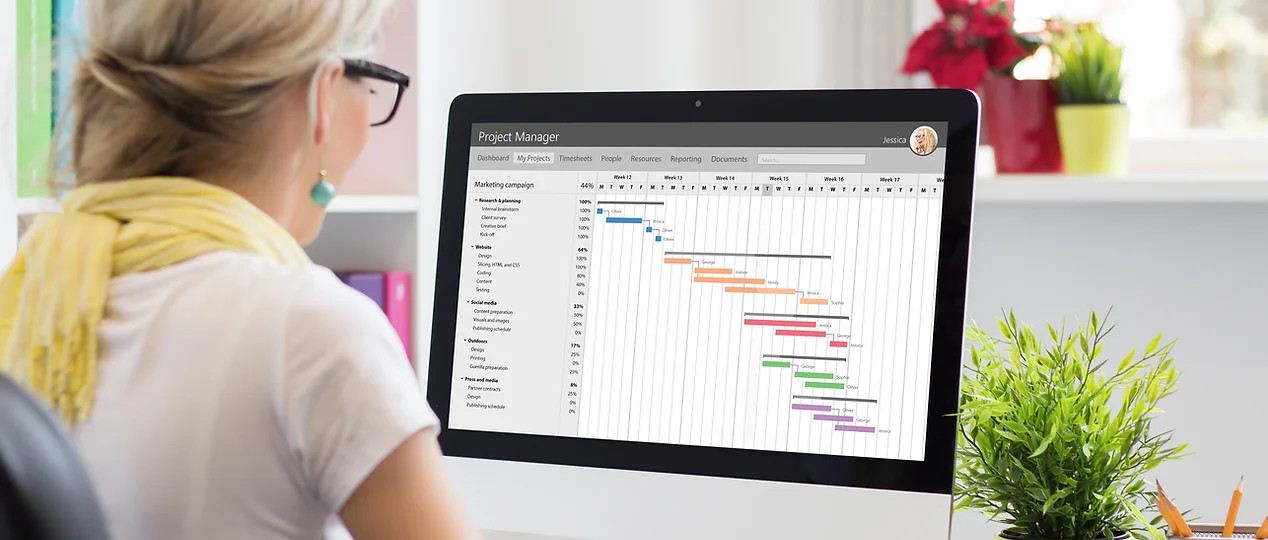
Gantt charts offer a visual representation of tasks and their timelines, making it easy for project managers and team members to grasp the project’s progression at a glance. Color-coded bars help differentiate between tasks and understand their statuses.
When working on a project with multiple team members, clear communication is key. Gantt charts provide a visual reference that everyone can understand, facilitating better communication and reducing the risk of misunderstandings.
Gantt charts enable you to plan and schedule tasks more effectively by highlighting dependencies and deadlines. This proactive approach helps in avoiding delays and ensures a smoother project flow.
Gantt charts are not exclusive to a particular industry or role. Whether you are managing a construction project, organizing an event, or overseeing software development, Gantt charts can be customized to suit your specific needs. Project managers, team leaders, and individual contributors can all benefit from the insights and organization that Gantt charts provide.
To further illustrate the versatility of Gantt charts, here are a few examples of industries and projects where they are commonly used:
Creating a Gantt chart in Google Sheets is a straightforward process. Follow these steps:
While Google Sheets is a powerful tool for creating Gantt charts, there are other specialized project management tools that offer additional features. Some popular alternatives include:
Gantt charts are most effective when used as dynamic documents that are regularly updated to reflect the project’s current status. Here are some tips for utilizing Gantt charts effectively:
In conclusion, Gantt charts are invaluable tools for project and time management, and Google Sheets provides an accessible platform for creating and collaborating on these useful charts. By incorporating Gantt charts into your project management toolkit, you can enhance communication, improve planning, and achieve greater success in your endeavors.